01 / FRAGMENTATION
No shared release truth
Engineering, product, cybersecurity and management operate from different datasets and different definitions of ready.
EvidenceGraph connects requirements, code, builds, vulnerabilities, approvals and regulatory controls into one defensible executive release decision.
Requirements sit in DOORS. Delivery work lives in Jira and GitHub. Builds run in Jenkins. Vulnerabilities come from Qualys and Black Duck. Approvals are often fragmented across tickets, spreadsheets and email. EvidenceGraph correlates these signals before management accepts the release.
Engineering, product, cybersecurity and management operate from different datasets and different definitions of ready.
Exceptions are accepted informally, while ownership, approval timestamps, mitigation dates and residual risk remain unclear.
Teams reconstruct the decision after the fact instead of producing decision-grade evidence at the moment of release.
EvidenceGraph turns fragmented engineering evidence into an explicit, accountable release decision. The result is not another dashboard, but a governance layer that helps programs reach Start of Production with fewer late surprises, less unmanaged risk and a defensible record of who approved what.
EvidenceGraph correlates requirements, code, builds, vulnerabilities and approvals so that hard blockers, weak traceability and unresolved exceptions are visible early enough to act.
Every exception can be linked to its evidence, residual risk, accountable owner, approval, mitigation date and management decision. This supports a more defensible release process and reduces ambiguity after an incident or audit.
Programs can focus scarce engineering capacity on what truly threatens SoP. Non-critical gaps can move through a controlled Conditional Go path, while red-line issues remain visible and non-negotiable.
EvidenceGraph creates value in three places: it reduces manual preparation effort around release boards, helps avoid late-cycle escalation and rework, and protects SoP by surfacing what truly threatens launch timing. In the illustrative model shown below, one SoP-critical automotive software program yields about €758.8k in annual quantified benefit against an assumed €180k annual investment, equivalent to roughly 4.2x ROI and payback in less than four months. The reverse case is equally important: without connected release evidence, organizations remain exposed to manual overhead, delay costs, release incidents and avoidable liability, adding up to roughly €1.29M in annual exposure.
Net value of €578.8k after an illustrative annual investment of €180k. Main drivers are SoP protection, avoided late-cycle rework and lower decision-preparation effort.
The largest downside is usually not software spend, but unmanaged release risk: SoP delay exposure, incident remediation, escalation effort and weak accountability.
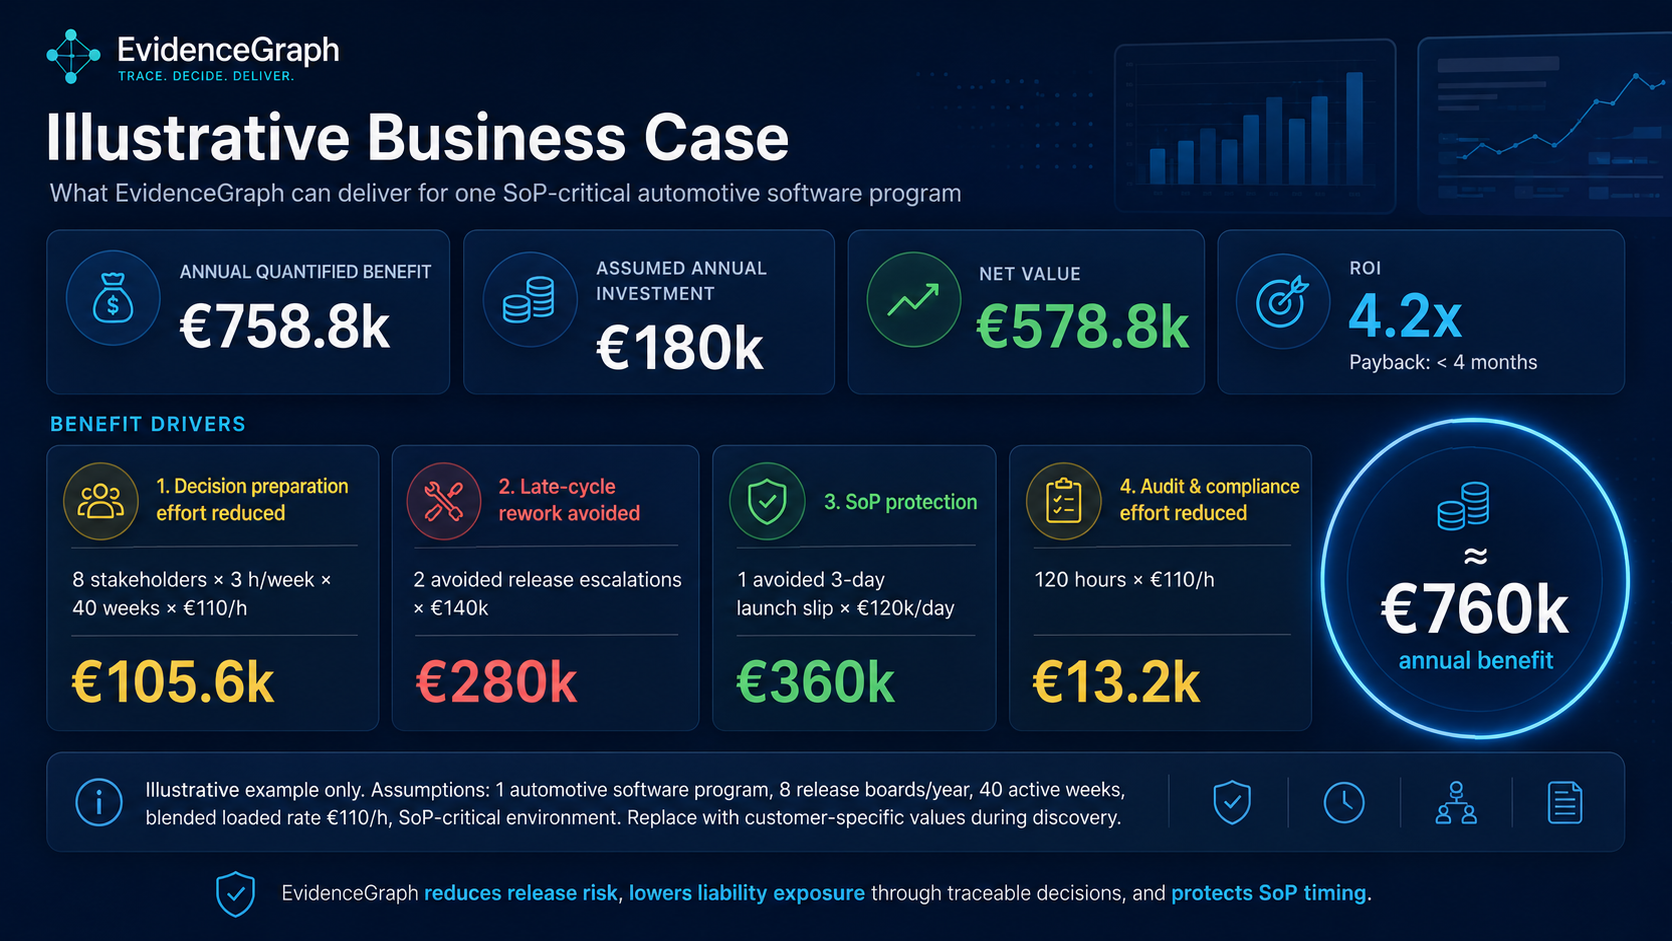
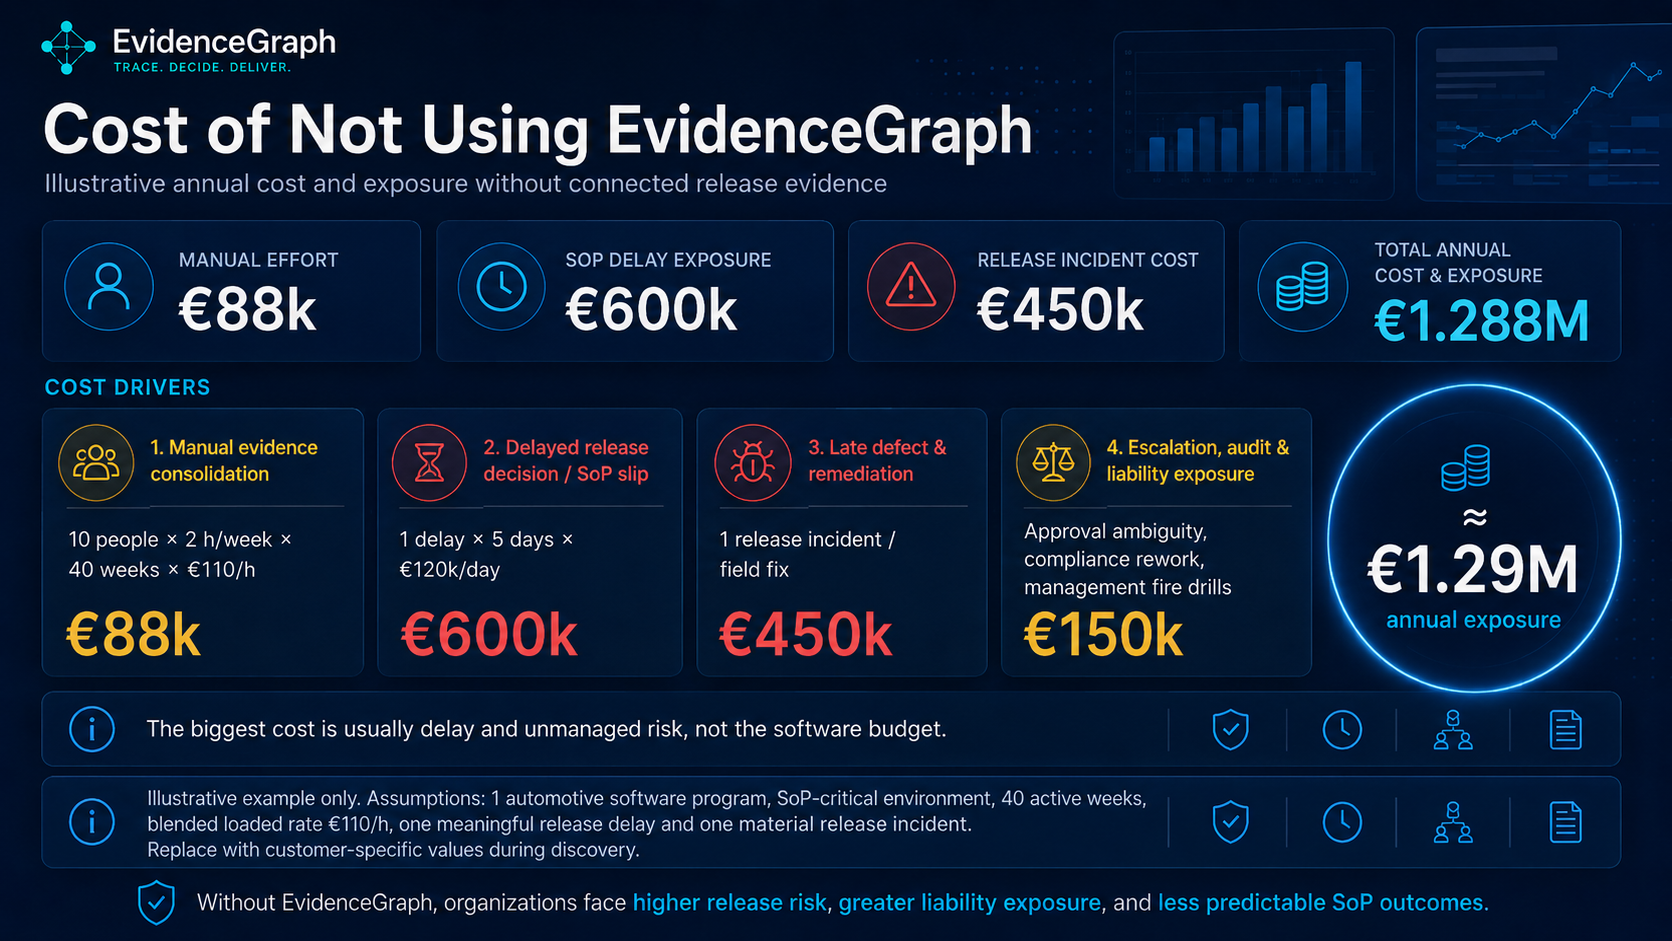
Note: These calculations are illustrative and intended for executive orientation. Final numbers should be calibrated in discovery using the customer’s release cadence, SoP criticality, loaded engineering rates, delay economics, compliance burden and incident profile.
Adjust the assumptions to reflect one software program. The calculator estimates annual benefit, cost of inaction, net value, ROI and payback. Values are indicative and should be validated with the customer during discovery.
Methodology: quantified benefit equals saved decision-preparation effort, avoided late-cycle rework, protected SoP timing, reduced audit effort and the selected risk-adjusted share of incident exposure. ROI is annual benefit divided by annual investment. Cost of inaction combines the modeled operational and release-risk exposure before the EvidenceGraph investment.
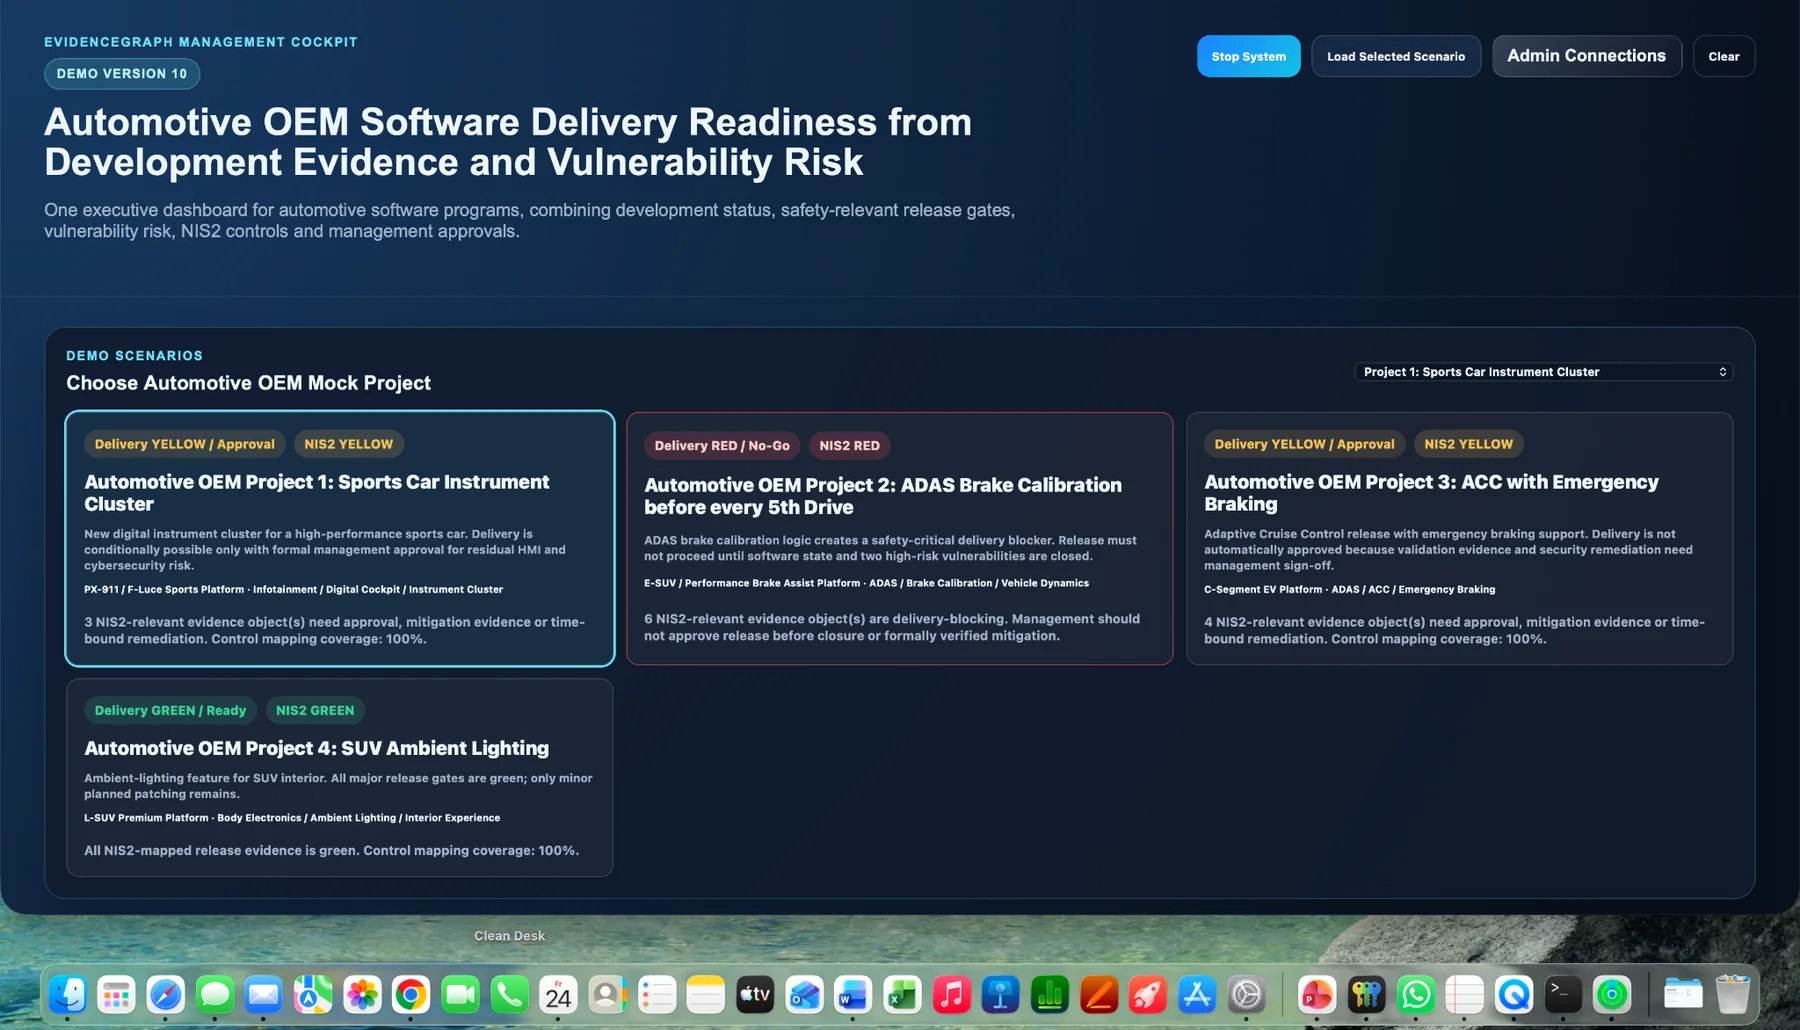
The web demo models realistic automotive software programs and converts their engineering and security evidence into a management recommendation.
A new digital instrument cluster for a high-performance sports car. Delivery is conditionally possible with formal approval for residual HMI and cybersecurity risk.
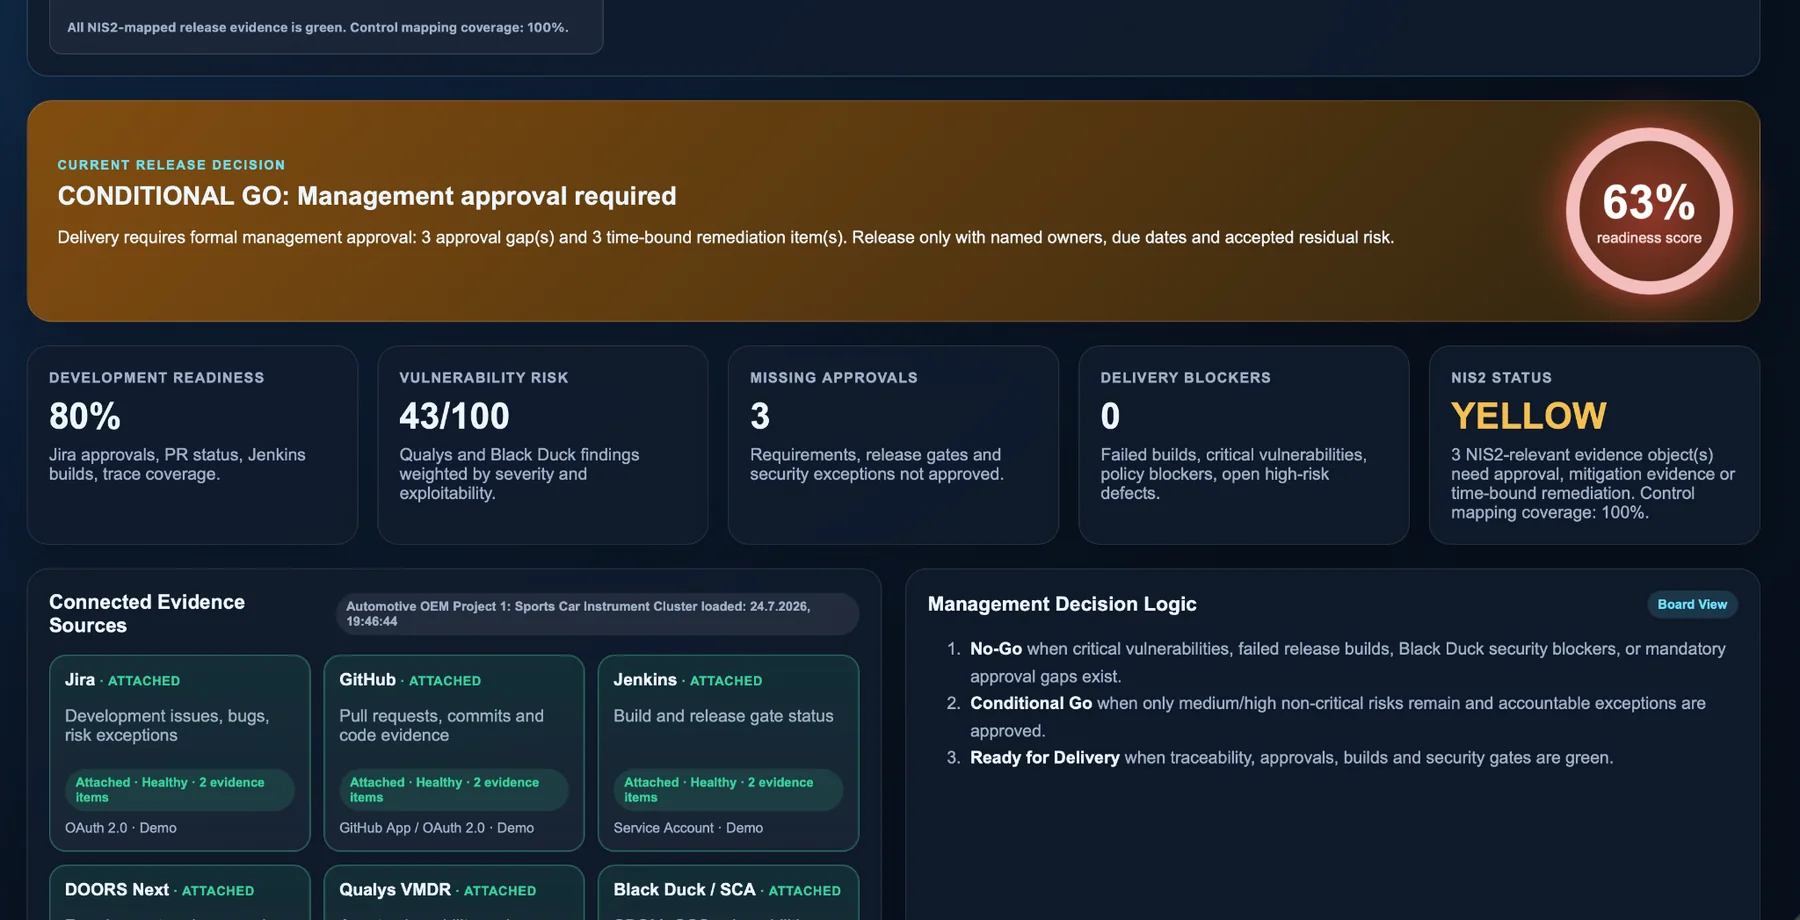
EvidenceGraph does not replace engineering systems. It connects their evidence, evaluates release criteria and exposes what management must approve.
Use evidence from the systems teams already trust.
Link requirements, code, builds, vulnerabilities, approvals and NIS2 controls.
Deliver a transparent release recommendation and a defensible management record.
Vehicle platforms, ADAS, cockpit, infotainment, body electronics and software-defined vehicle programs.
Connected products, industrial automation, energy systems and regulated digital infrastructure.
NIS2-oriented evidence, vulnerability remediation, exception approval and executive accountability.
No black-box score. Users can inspect the release gate, trace linked objects and open the decision evidence document behind every green, yellow or red signal.
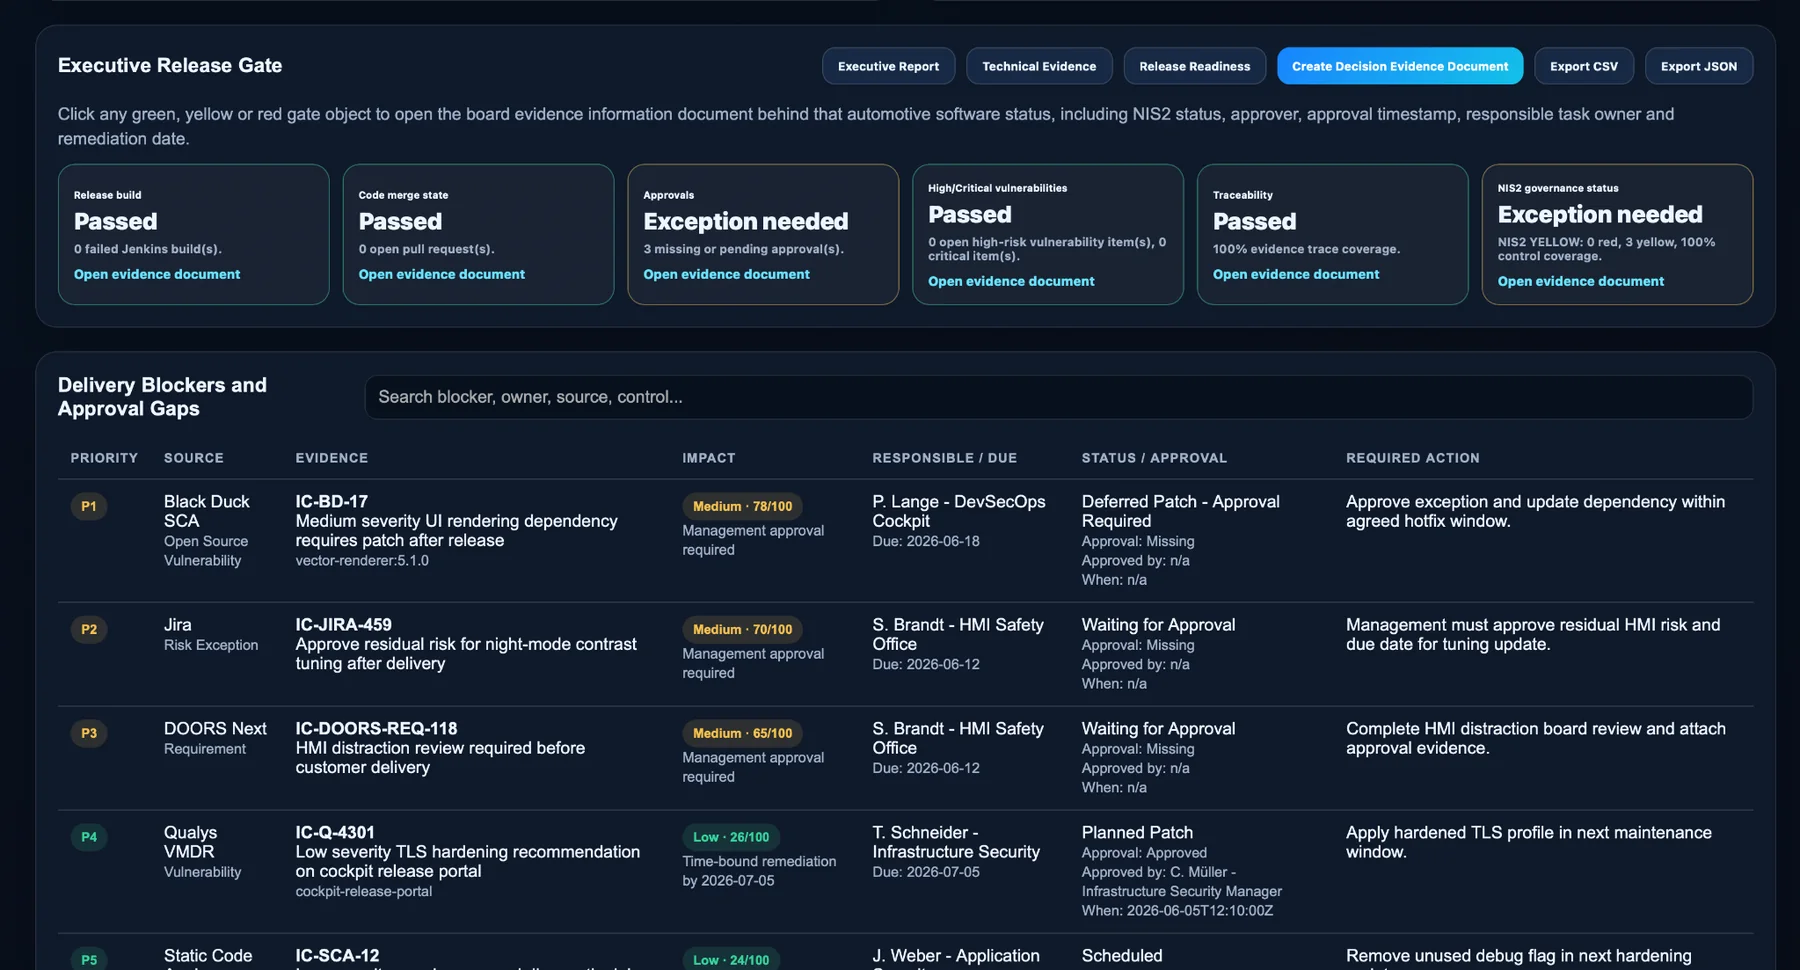
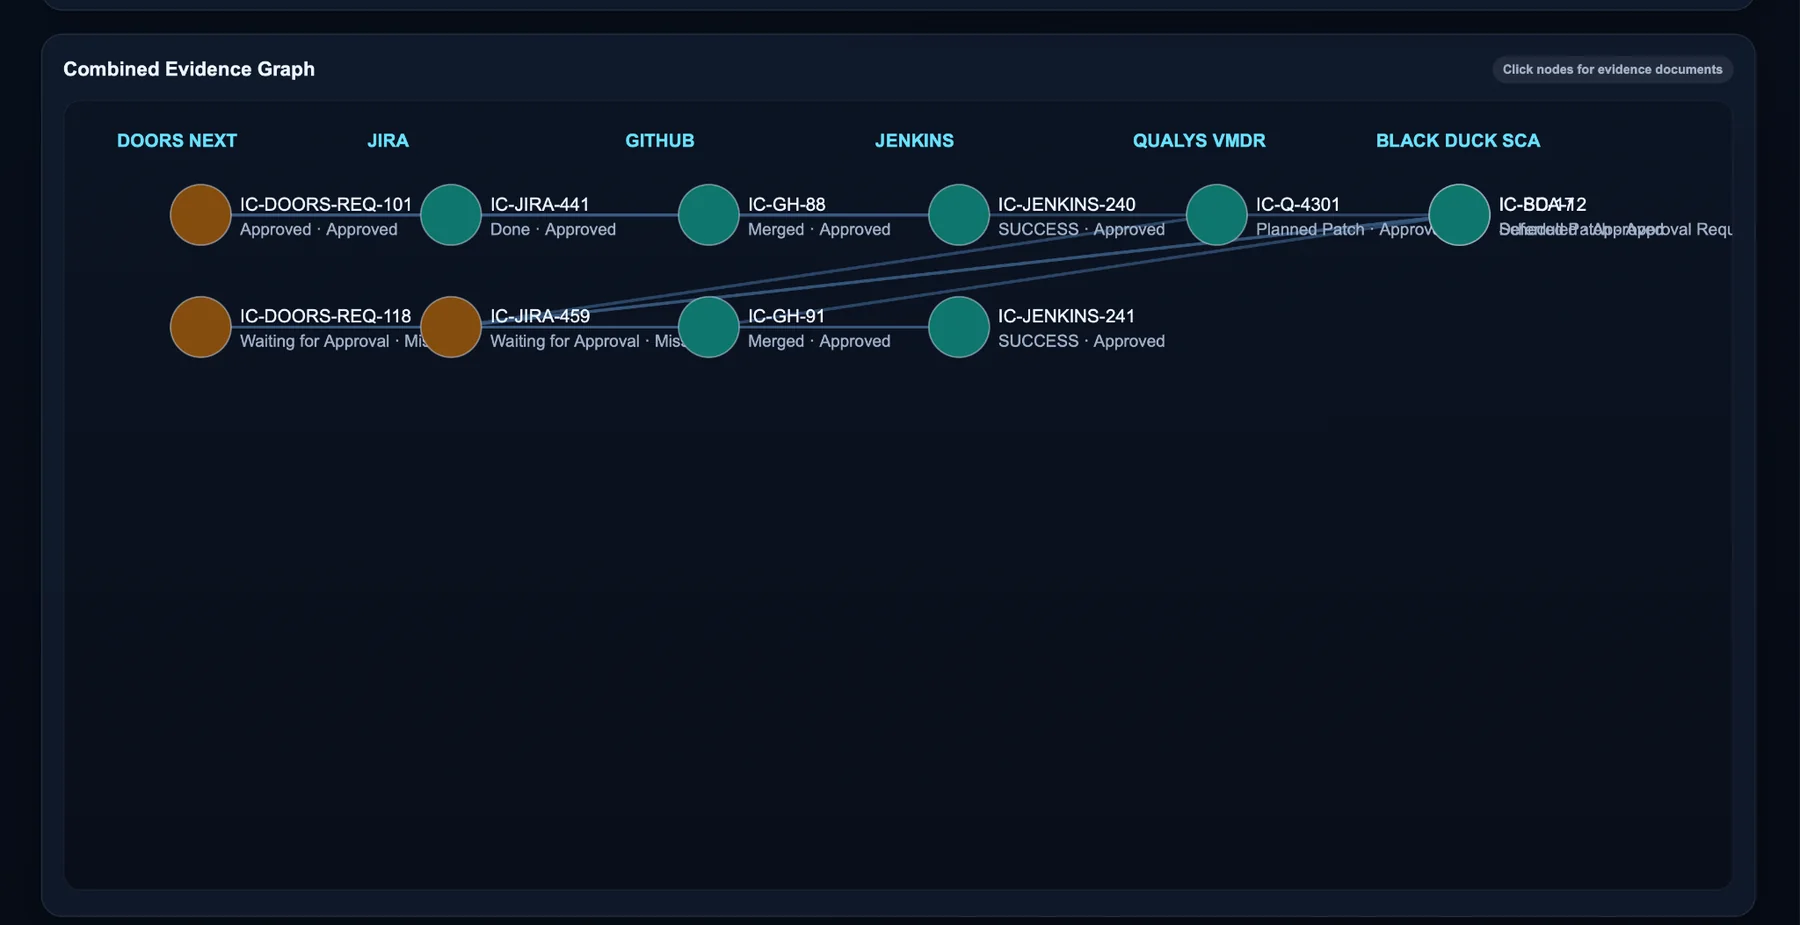
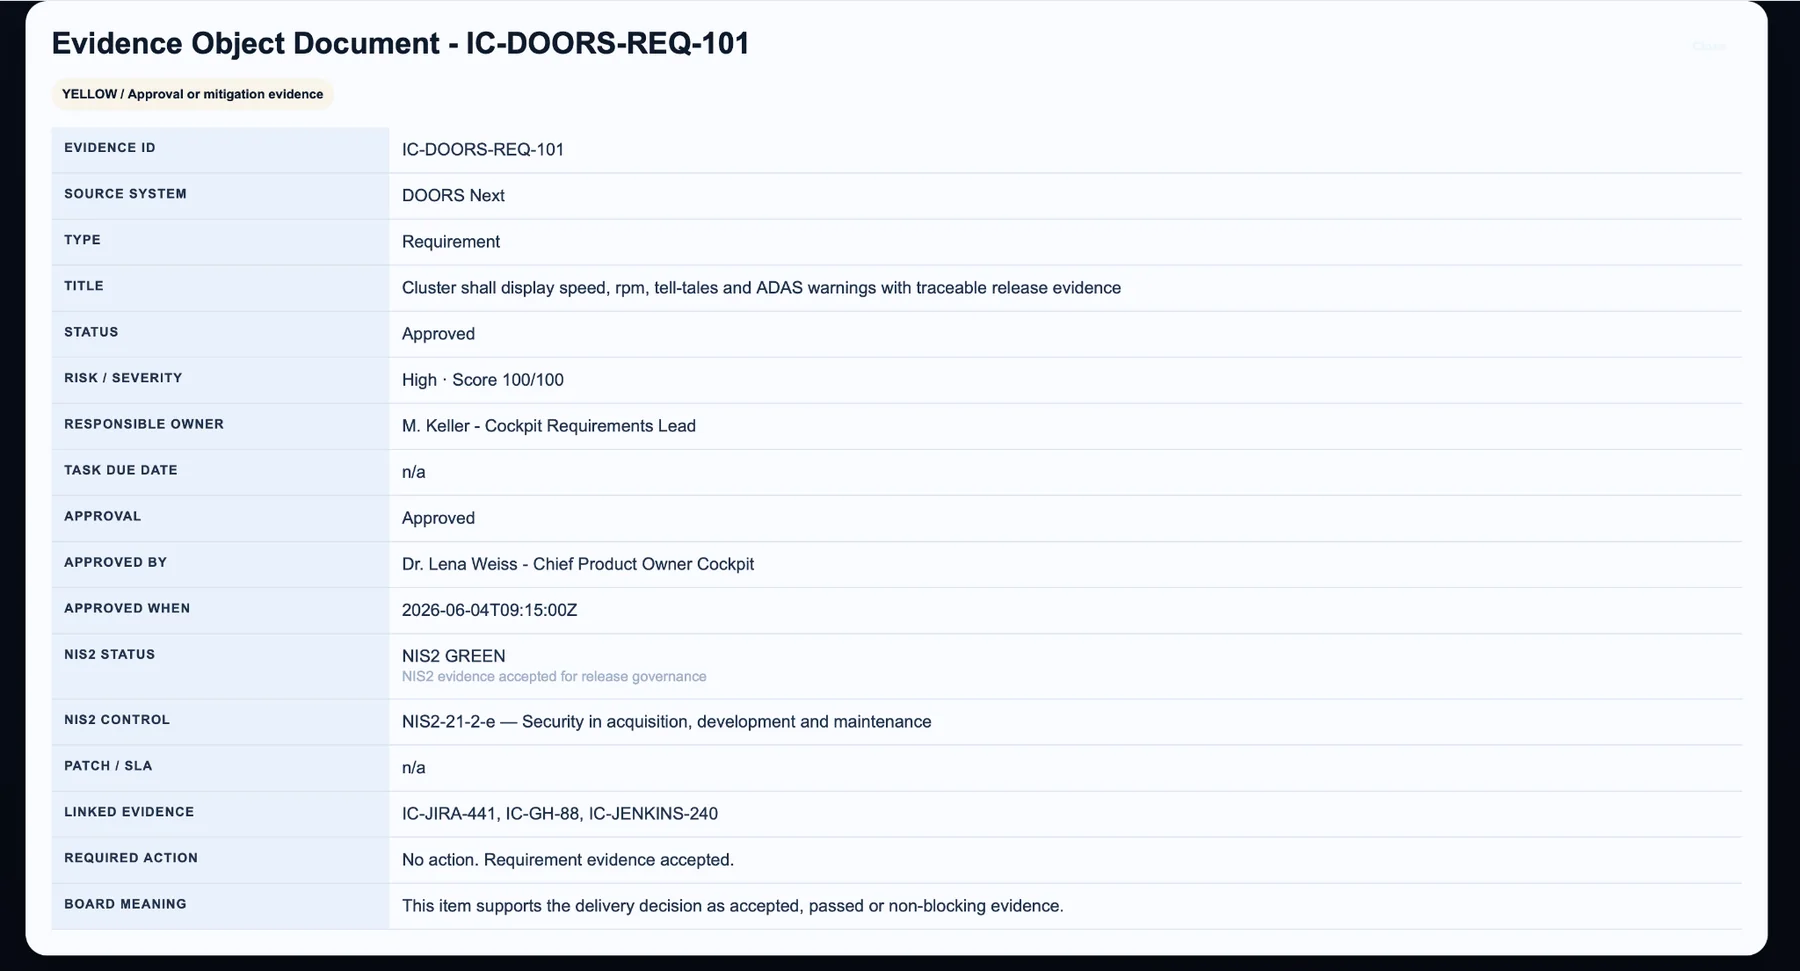
EvidenceGraph gives executives a controlled path between blind approval and unnecessary delay: stop true blockers, formally own residual risk and keep the launch decision explainable.
Evidence is fragmented, decisions are subjective and accountability is difficult to reconstruct.
Management sees what is green, what requires approval, who owns the risk and when mitigation is due.
Book a focused executive demo using an automotive OEM scenario or your own delivery governance challenge.